Table of Contents
SQL Server Error: 1225
Severity: 16
Event Logged or not: No
Description:
An invalid application lock mode was passed to %ls.
Severity 16 Description:
Indicates general errors that can be corrected by the user.
Identifying SQL Server Error Log File used by SQL Server Database Engine can be done by reading SQL Server Error Logs. DBA can execute the XP_READERRORLOG extended stored procedure to read the SQL Server Error Log and search for its location used by the instance of SQL Server.
USE master

Go

xp_readerrorlog 0, 1, N'Logging SQL Server messages in file', NULL, NULL, N'asc'

Go
SQL Server listens on TCP/1433 by default on a default instance. It is possible to alter this. Unless otherwise specified, SQL Server listens on a dynamic TCP port on a named instance. If SQL Server detects that the port is already in use, it will select a different TCP port. In the event of a named instance, clients normally find the correct port by contacting the SQL Server Listener Service/SQL Browser. This is connected to UDP/1434 and cannot be modified. You can configure a static port if you have a named instance, and you should if you need Kerberos authentication/delegation.
The first step is to figure out what port your SQL Server is listening on.
Then you’ll need to check with your networking/security team to see if VPN communication to that port is permitted. Check your firewall settings if they are as suggested. Multiple firewalls are installed on some systems (my laptop is an example). If this is the case, you should check all of your system’s firewalls.
If all of these are valid, check to see if the server has an IPSEC policy blocking access to the SQL Server port through IP address. You may possibly be blocked as a result of this.
To restart the SQL Service -> Enter services by pressing WindowsKey + R.
Scroll down once Services has opened to find the service. Server SQL
Select the service and press START.
Reconnect to your MSSQL instance after the service has started.
It should now function properly, allowing you to connect to your MSSQL instance and run queries.
Check SQL Server CPU, Memory usage, longest running queries, deadlocks etc.. using activity monitor or sp_who2.
To view Activity Monitor in SQL Server 2005 and in SQL Server 2008, a user must have VIEW SERVER STATE permission.
2 Different Ways to Open up Activity Monitor in SQL Server 2008 are mentioned below:
Open up Activity Monitor Using Object Explorer
In Object Explorer, right click the SQL Server 2008 Instance and click on Activity Monitor.
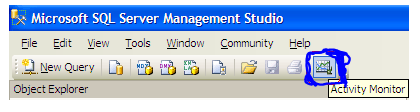
Also can be opened from SQL Server 2008 Management Studio’s toolbar, by clicking Activity Monitor
It shows the graphical display of Processor Time (%), Number of Waiting Tasks, Database I/O (MB/Sec) and the Number of Batch Requests/second.
For information on SQL Server Activity monitor go to https://sqlserver-dba.co.uk/sql-server-administration-basics/activity-monitor
Or using SQL Query analyzer window to run sp_who2 command which is less resource intensive and gives same information as activity monitor.
SQL Server Error: 1225
Severity: 16
Event Logged or not: No
Description:
An invalid application lock mode was passed to %ls.
Use Activity monitor, sp_who2 or dbcc opentran() to check active connections if you are able to connect. or try check if sql is accepting new connections or not. Restart SQL Services if thats not a issue and its not production instance.
Learn about SQL Server detecting logical consistency based issues and how to resolve them.
Learn about SQL Server error 1222 and how to resolve the lock request time out…
Discover the new features of Microsoft SQL Server 2022 and how they compare to previous…
SQL Server Error 1222 lock request time out period exceeded Lock request time out…
SQL Server Error : 427, Severity: 20. Could not load the definition for constraint ID…
SQL Server Error : 204, Severity: 20. Normalization error in node %ls.
This website uses cookies.