Table of Contents
SQL Server Error: 1976
Severity: 16
Event Logged or not: No
Description:
Cannot create index or statistics ‘%.*ls’ on view ‘%.*ls’ because cannot verify key column ‘%.*ls’ is precise and deterministic. Consider removing column from index or statistics key, marking column persisted in base table if it is computed, or using non-CLR-derived column in key.
Severity 16 Description:
Indicates general errors that can be corrected by the user.
Identifying SQL Server Error Log File used by SQL Server Database Engine can be done by reading SQL Server Error Logs. DBA can execute the XP_READERRORLOG extended stored procedure to read the SQL Server Error Log and search for its location used by the instance of SQL Server.
USE master

Go

xp_readerrorlog 0, 1, N'Logging SQL Server messages in file', NULL, NULL, N'asc'

Go
The parameters for XP_READERRRORLOG are:
1. Value of error log file we would like to read. values are 0 = current, 1 = last one before current, 2 = second last before current etc…
2. Log file type:- 1 or NULL = error log, 2 = SQL Agent log
3. Search string 1:- String one you want to search for
4. Search string 2:- String two you want to search for to further refine the results
5. start time for Search
6. end time for search
7. Sort order for search results:- N’asc’ = ascending, N’desc’ = descending
By default, we have 6 Server Error Logs kept but we can increase the number of SQL Server Error Logs from the default value of six.
For other ways to read and find error log location please our artcile https://sqlserver-dba.co.uk/error-log/sql-server-identify-location-of-the-sql-server-error-log-file.html
Check SQL Server CPU, Memory usage, longest running queries, deadlocks etc.. using activity monitor or sp_who2.
To view Activity Monitor in SQL Server 2005 and in SQL Server 2008, a user must have VIEW SERVER STATE permission.
2 Different Ways to Open up Activity Monitor in SQL Server 2008 are mentioned below:
Open up Activity Monitor Using Object Explorer
In Object Explorer, right click the SQL Server 2008 Instance and click on Activity Monitor.
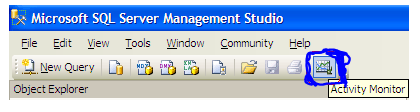
Also can be opened from SQL Server 2008 Management Studio’s toolbar, by clicking Activity Monitor
It shows the graphical display of Processor Time (%), Number of Waiting Tasks, Database I/O (MB/Sec) and the Number of Batch Requests/second.
For information on SQL Server Activity monitor go to https://sqlserver-dba.co.uk/sql-server-administration-basics/activity-monitor
Or using SQL Query analyzer window to run sp_who2 command which is less resource intensive and gives same information as activity monitor.
SQL Server Error: 1976
Severity: 16
Event Logged or not: No
Description:
Cannot create index or statistics ‘%.*ls’ on view ‘%.*ls’ because cannot verify key column ‘%.*ls’ is precise and deterministic. Consider removing column from index or statistics key, marking column persisted in base table if it is computed, or using non-CLR-derived column in key.
Learn about SQL Server detecting logical consistency based issues and how to resolve them.
Learn about SQL Server error 1222 and how to resolve the lock request time out…
Discover the new features of Microsoft SQL Server 2022 and how they compare to previous…
SQL Server Error 1222 lock request time out period exceeded Lock request time out…
SQL Server Error : 427, Severity: 20. Could not load the definition for constraint ID…
SQL Server Error : 204, Severity: 20. Normalization error in node %ls.
This website uses cookies.